Visualize Shellshock Detectify Testing
After getting logstash, elasticsearch and kibana setup I realized I could watch an “attack” in real time. Following the recent Bashocalypse I was pointed to http://shellshock.detectify.com. I never recommend testing an insecure domain against an outside tool but in my case I had already patched bash to bash-4.1.2-15.19 so I felt like this would be safe enough to do.
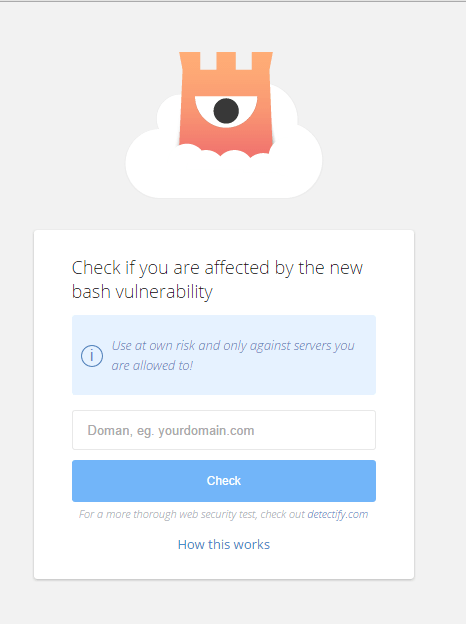
You are presented with the following page when you click the link above:

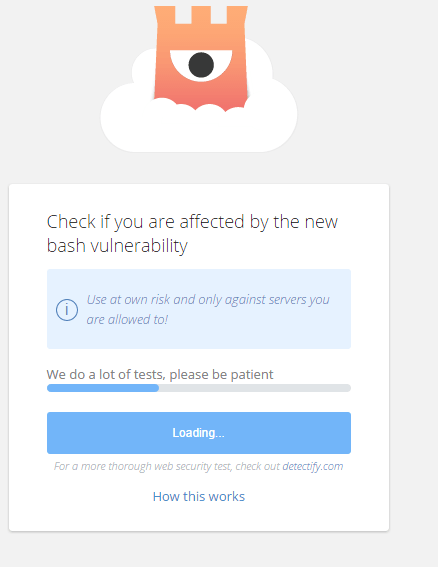
Enter your domain name and click “Check”, the tests will begin and the process will be shown as below:

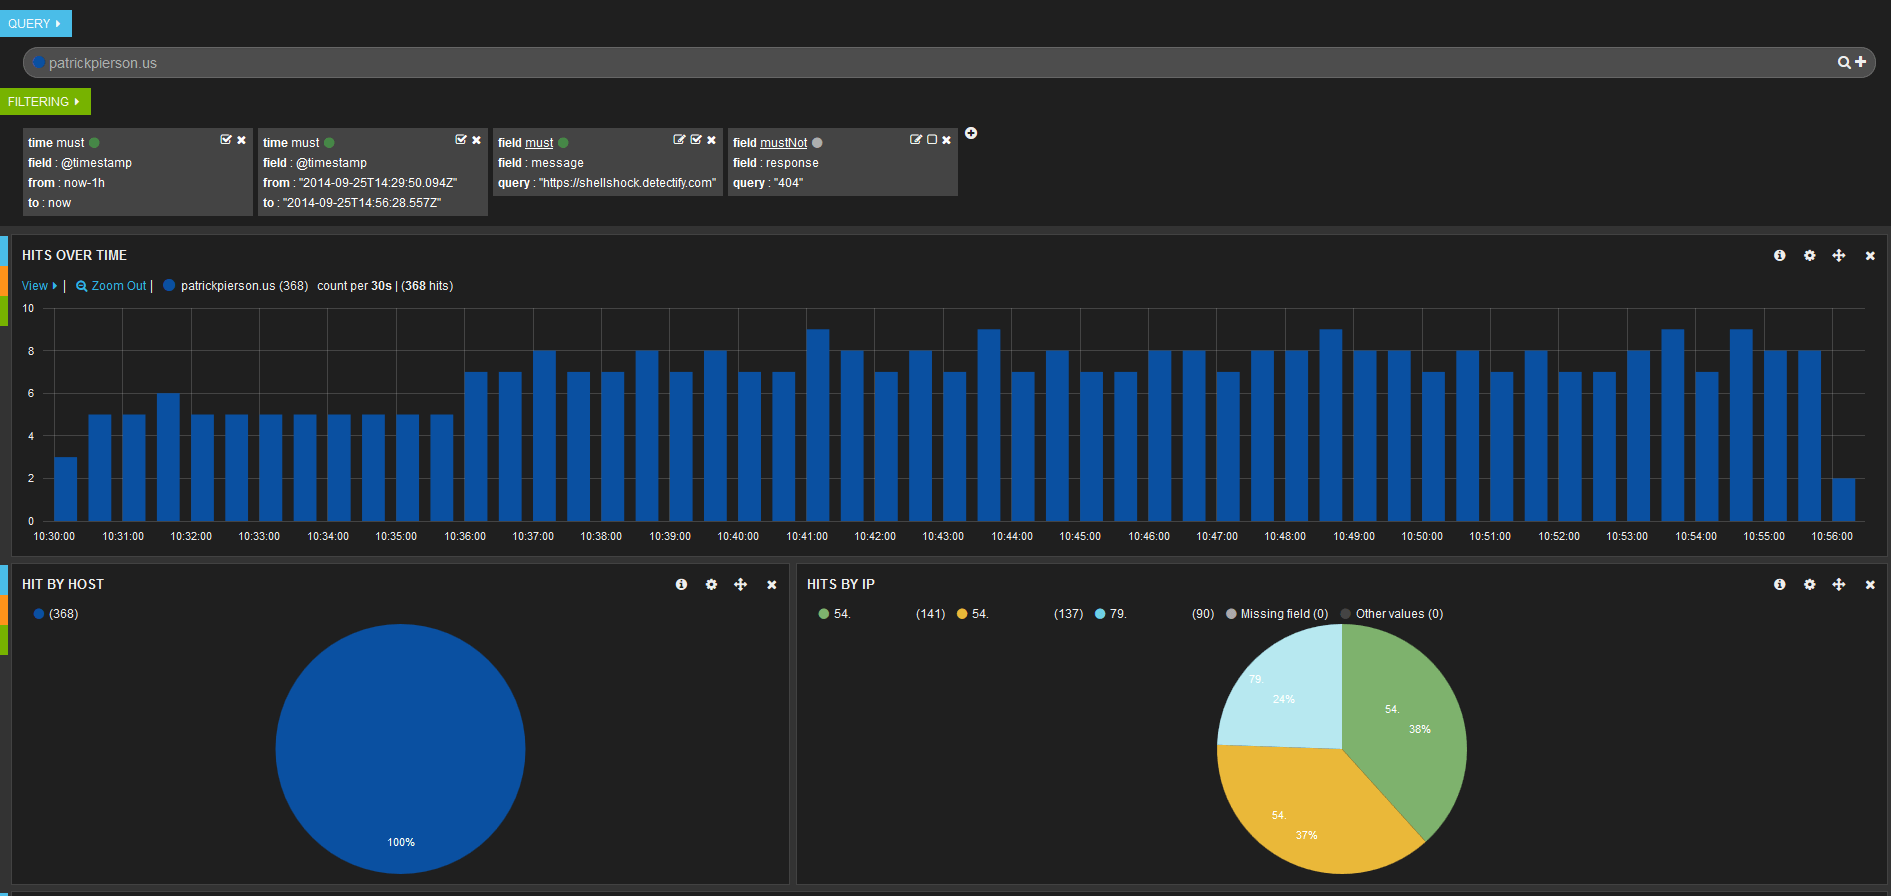
As the checks start coming in I modified my queries in Kibana to show them:

I have removed the test IPs because I don’t like exposing other peoples IP address. I made sure to only show messages that had shellshock.detectify.com in the user-agent section of the GET request. I also had the query for “404” but I am not including an image of it in place because the result was a mostly blank graph with 1 entry that was the initial 200 for the “attacker” on my domain.
I have included a txt document of all the requests here (shellshock.txt).
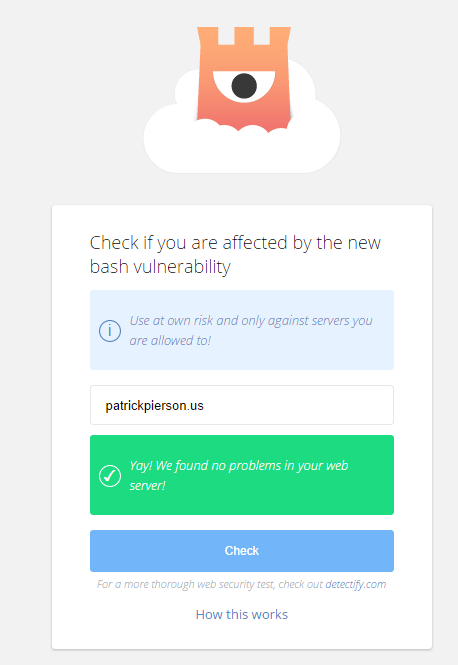
Lastly once it was done:
