Elasticsearch, Logstash, and Kibana to visualize logs
I recently had a remote IP attacking my server. I was alerted to the attack by Amazon’s cloudwatch when the attack raised my instance’s CPU above 90%. After that I decided I needed to start watching my logs closer. The Elasticsearch stack is perfect for this. After installing Logstash to pull the logs for my various domains I had an output set to push the logs to S3 and Elasticsearch. Kibana is used to visualize the collected logs.
All steps are preformed on Amazon Linux.
Install Logstash
To install Logstash you will first need install Java. The version I tested on was java-1.7.0-openjdk.x86_64. Install with the following command “yum install java-1.7.0-openjdk.x86_64“. Once java is installed you will need to download the Logstash rpm. As of this writing the current version is 1.4.2. Navigate to http://www.elasticsearch.org/overview/logstash/download/ and select “RPM”. Install the rpm by running the following command “yum localinstall logstash-*.rpm“. In my setup I have httpd creating logs for each domain seperately. I also wanted to save the processed logs to AWS S3 as well as ElasticSearch. My config for Logstash is below:
input {
  file {
    path = "/var/log/httpd/*_access_log"
    type = "apache-access"
  }
}

filter {
  grok {
    type = "apache-access"
    pattern = "%{COMMONAPACHELOG}"
  }
}

output {
  stdout {}
  s3 {
    access_key_id = "AWS_ACCESS_KEY_ID"
    secret_access_key = "AWS_SECRET_KEY"
    bucket = "logs"
    format = "json"
    size_file = "1000000"
    time_file = "5"
    endpoint_region = "us-east-1"
  }

  elasticsearch_http{
    host = "elasticsearch_ip"
    index = "logs"
  }
}
This file is saved to “/etc/logstash/conf.d/local.conf”. To start Logstash run “service Logstash start“. FYI, I had to run “chmod -R 755 /var/log/httpd” to allow Logstash access to the httpd log directory. Run “chkconfig logstash on” to make sure it starts on reboot.
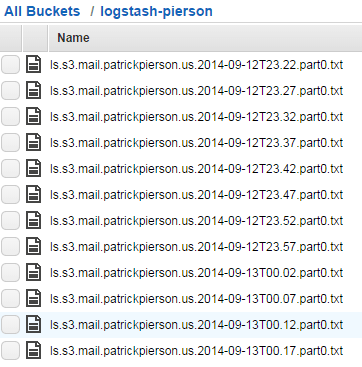
S3 should start to look like this:
Install Elasticsearch
Elasticsearch is next. As long as java was already installed you can skip that. Currently the latest version of Elasticsearch is 1.3.2. Download it here and click on the RPM. Install the rpm with:
yum localinstall elasticsearch*.rpm
Once installed start it with:
service elasticsearch start
I prefer to install the “head” and “bigdesk” plugins to monitor my elasticsearch clusters.
Head is installed by running the following command:
/usr/share/elasticsearch/bin/plugin -install mobz/elasticsearch-head
I have talked about the bigdesk plugin before here.
Restart elasticsearch with:
service elasticsearch restart
and set it to run on boot up with:
chkconfig elasticsearch on
At this point you will most likely need to restart logstash so it will be able to contact the elasticsearch server.
Install Kibana
Kibana is pretty easy to install. First install nginx with:
yum install nginx
Next download kibana from
http://www.elasticsearch.org/overview/kibana/installation/. You will need to download either the zip or tar.gz.
Extract it to /usr/share/nginx/html/ and modify config.js. The only section I had to modify in this file was the
following:
elasticsearch: “http://elasticsearch_IP:9200″
Start Kibana with:
service nginx start
and make sure it starts on boot with:
chkconfig nginx on
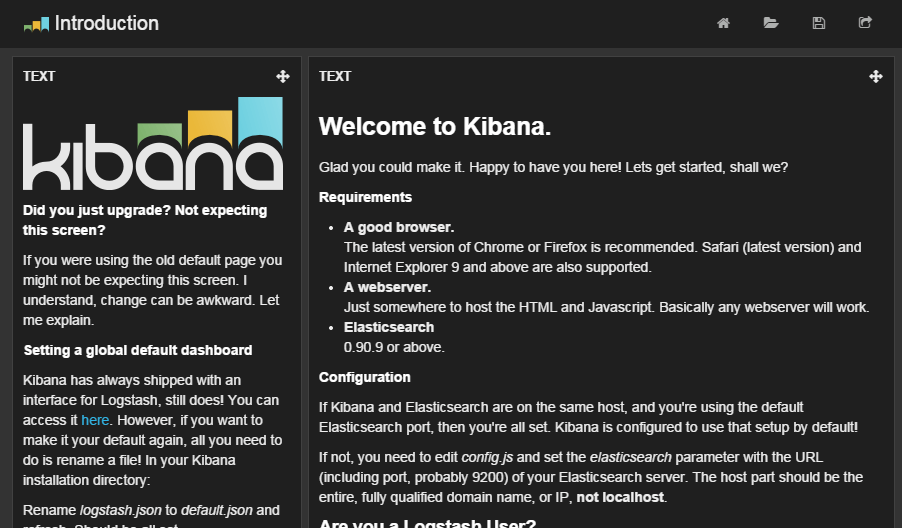
Once this is modified you can navigate to http://kibana_nginx_ip and you will be presented with the following:
Put it all together
Now that you have logs visualized you will be able to setup views like the following:
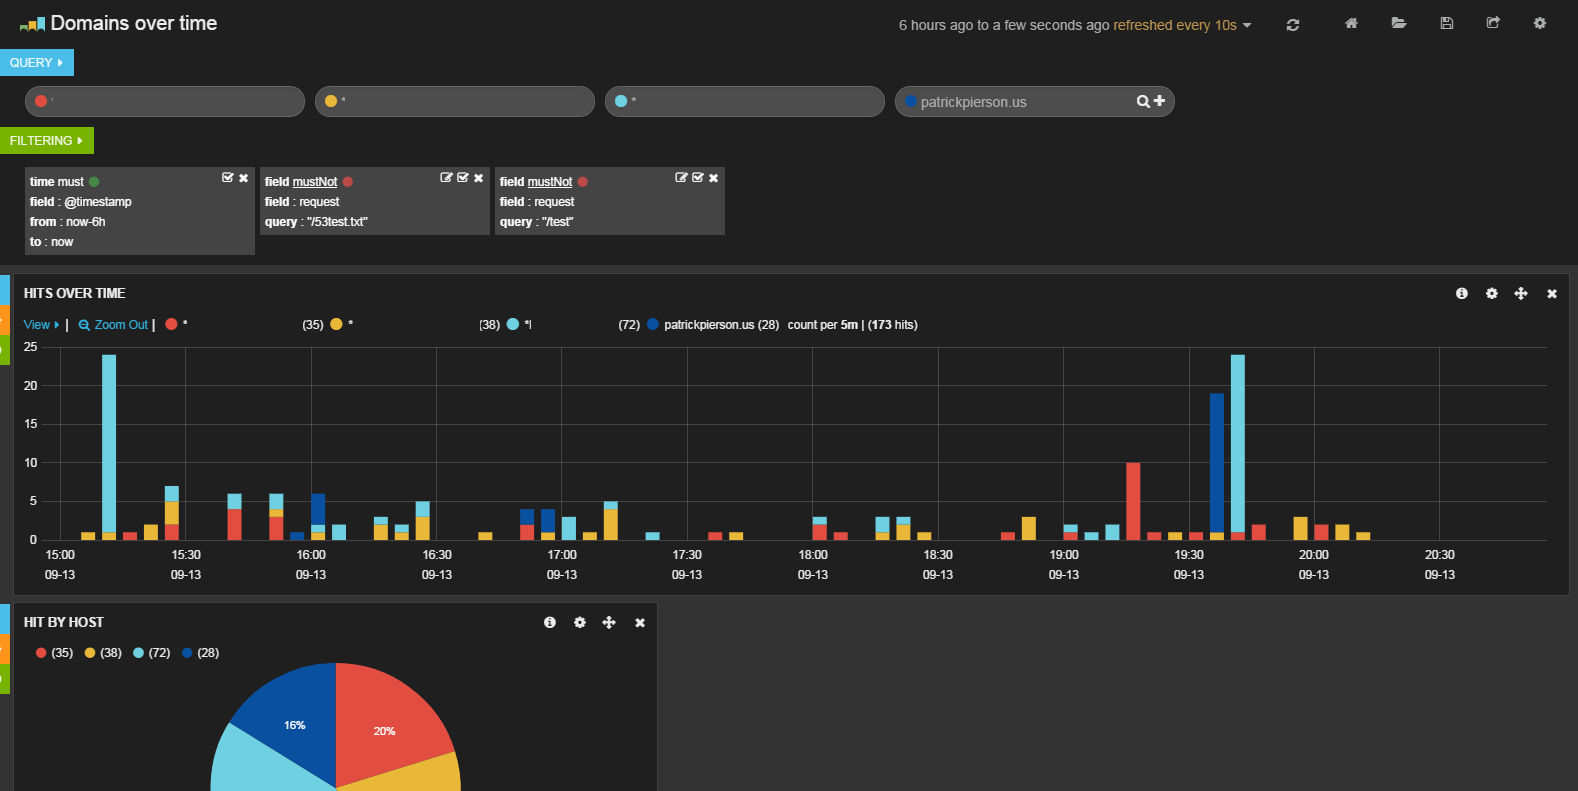
I removed the other domains I monitor for security concerns. It shows you the number of hits over the given time on each domain by color.
This image is another view in Kibana. It allowed me to visualize the number of attempts by domain where an IP attempted to login at “/wp-login.php” or tried to access a “wp-admin” page.
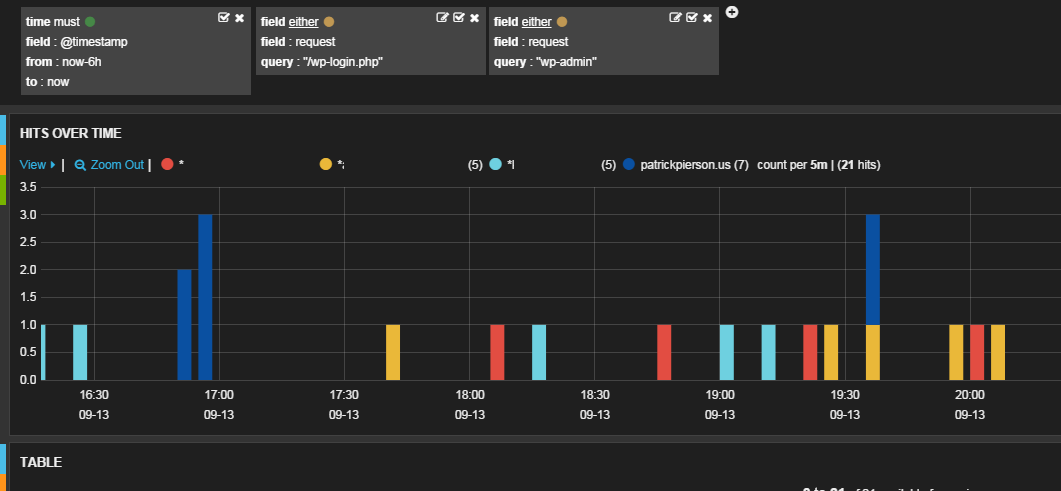
edit: A few hours after posting this I discovered an IP address that was attempting to login on a few of my sites. See below:
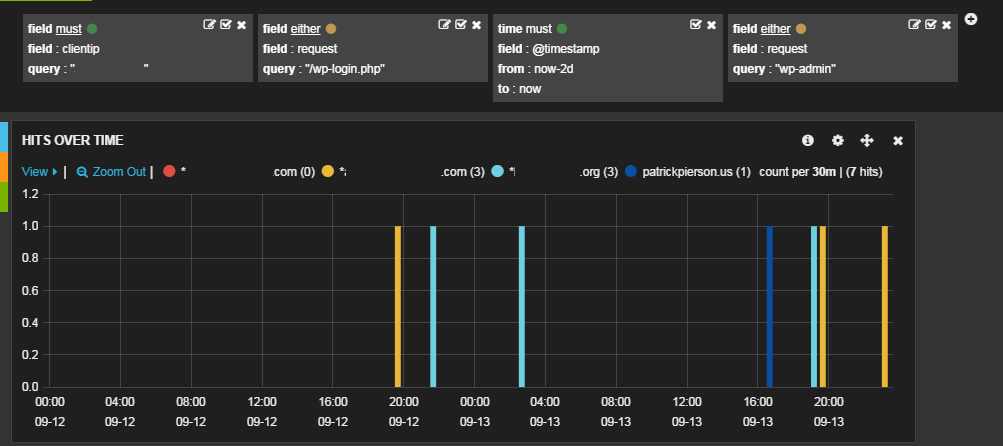
As you can see this clientIP accessed wp-login.php on multiple domains over the past 2 days.
I am sure its a bot just attempting to login and not specifically targeted at me. I blocked it by adding a drop rule
to iptables like so:
iptables -A INPUT -s 111.222.333.444 -j DROP